3 Best Practices for Selling Your House This Year
A new year brings with it the opportunity for new experiences. If that resonates with you because you’re considering making a move, you’re likely juggling a mix of excitement over your next home and a sense of attachment to your current one.
A great way to ease some of those emotions and ensure you’re feeling confident in your decision is to keep these three best practices in mind.
1. Price Your Home Right
The housing market shifted in 2022 as mortgage rates rose, buyer demand eased, and the number of homes for sale grew. As a seller, you’ll want to recognize things are different now and price your house appropriately based on where the market is today. Greg McBride, Chief Financial Analyst at Bankrate, explains:
“Price your home realistically. This isn’t the housing market of April or May, so buyer traffic will be substantially slower, but appropriately priced homes are still selling quickly.”
If you price your house too high, you run the risk of deterring buyers. And if you go too low, you’re leaving money on the table. An experienced real estate agent can help determine what your ideal asking price should be.
2. Keep Your Emotions in Check
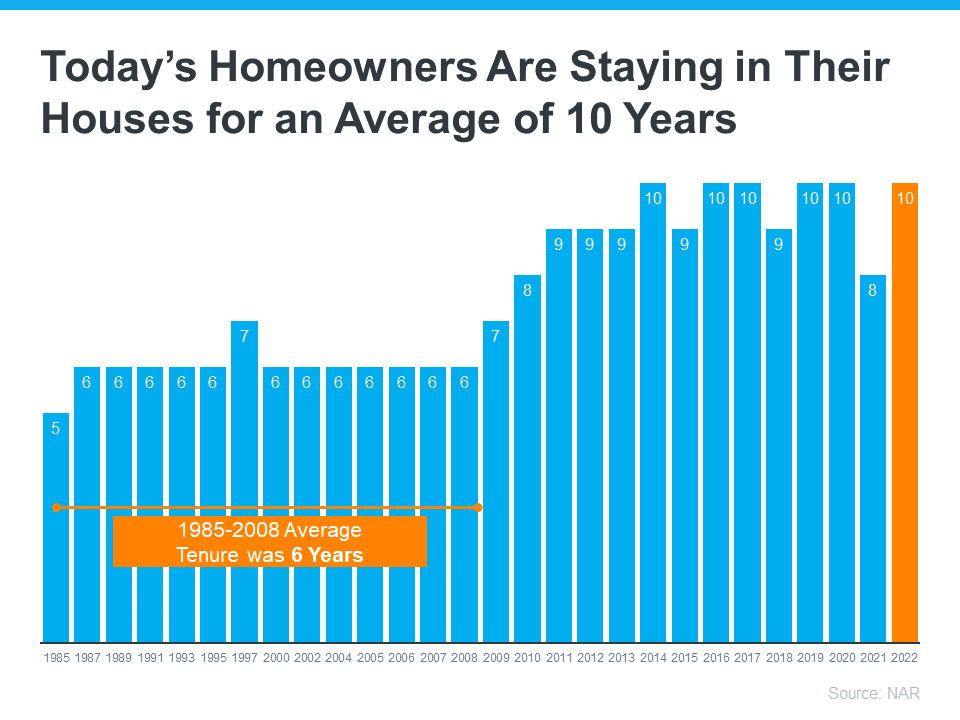
Today, homeowners are living in their houses longer. According to the National Association of Realtors (NAR), since 1985, the average time a homeowner has owned their home has increased from 5 to 10 years (see graph below):
This is several years longer than what used to be the historical norm. The side effect, however, is when you stay in one place for so long, you may get even more emotionally attached to your space. If it’s the first home you bought or the house where your loved ones grew up, it very likely means something extra special to you. Every room has memories, and it’s hard to detach from the sentimental value.
For some homeowners, that makes it even harder to negotiate and separate the emotional value of the house from fair market price. That’s why you need a real estate professional to help you with the negotiations along the way.
3. Stage Your Home Properly
While you may love your decor and how you’ve customized your home over the years, not all buyers will feel the same way about your design. That’s why it’s so important to make sure you focus on your home’s first impression so it appeals to as many buyers as possible. As NAR says:
“Staging is the art of preparing a home to appeal to the greatest number of potential buyers in your market. The right arrangements can move you into a higher price-point and help buyers fall in love the moment they walk through the door.”
Buyers want to envision themselves in the space so it truly feels like it could be their own. They need to see themselves inside with their furniture and keepsakes – not your pictures and decorations. A real estate professional can help you with tips to get your house ready to sell.
Bottom Line
If you’re considering selling your house, let’s connect so you have the help you need to navigate through the process while prioritizing these best practices.
Homeowners Still Have Positive Equity Gains over the Past 12 Months

If you’re a homeowner, your net worth got a big boost over the past few years thanks to rapidly rising home prices. Here’s how it happened and what it means for you, even as the market moderates.
Equity is the current value of your home minus what you owe on the loan.
Because there was a significant imbalance between the number of homes available for sale and the number of buyers looking to make a purchase over the past few years, home prices appreciated substantially.
And while home price appreciation has moderated this year, and even depreciated slightly in some overheated markets, that doesn’t mean you’ve lost all the equity you gained during the pandemic frenzy.
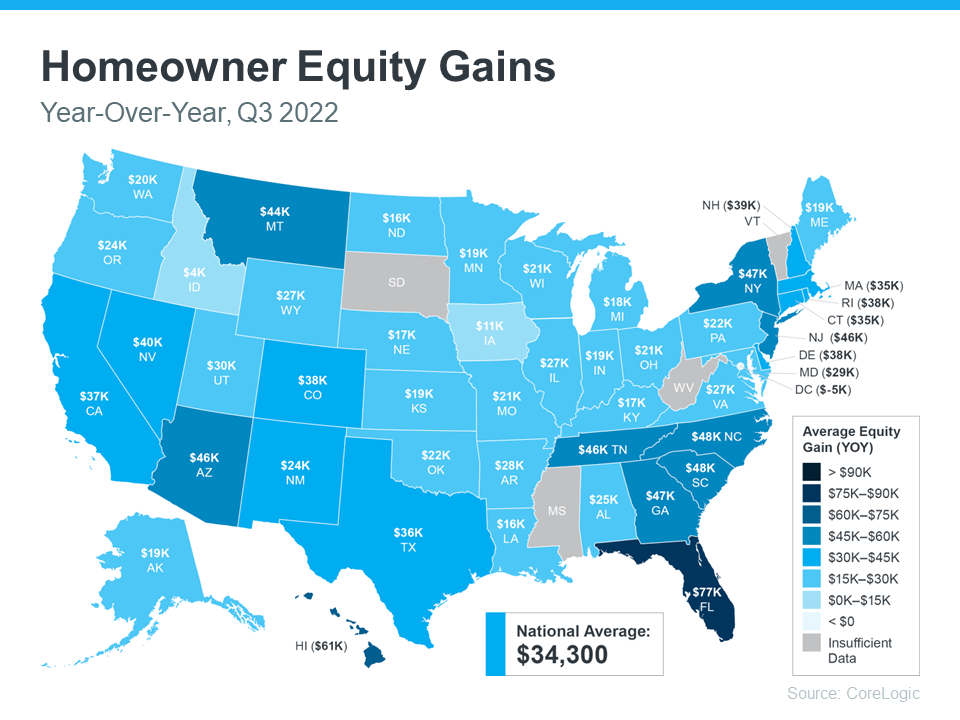
To prove you still have equity you can use, the latest Homeowner Equity Insights from CoreLogic finds the average homeowner equity has actually grown by $34,300 over the past 12 months.
That’s right, despite the headlines, the average homeowner still gained positive equity over the last year in just about every market. While the gains aren’t as dramatic as they were in the previous quarter due to home price moderation, they’re still significant. And if you’ve been in your home for longer than a year, chances are you have even more equity than you realize.
While that’s the national number, if you want to know what happened over the past year in your area, look at the map below from CoreLogic:
Why This Is So Important Right Now
While equity helps increase your overall net worth, it can also help you achieve other goals, like buying your next home. When you sell your current house, the equity you’ve built up comes back to you in the sale, and it may be just what you need to cover a large portion – if not all – of the down payment on your next home.
So, if you’ve been holding off on selling because you weren’t sure what the headlines meant for your bottom line, rest assured you’ve still gained equity in recent years, and it can help fuel your move.
Bottom Line
If you’re planning to make a move, the equity you’ve gained over time can make a big impact. To find out just how much equity you have in your current home and how you can use it to fuel your next purchase, let’s connect.
Planning to Retire? It Could Be Time To Make a Move.
Planning to Retire? It Could Be Time To Make a Move.

If you’re thinking about retirement or have already retired this year, you may be planning your next steps. One of your goals could be selling your house and finding a home that more closely fits your needs.
Fortunately, you may be in a better position to make a move than you realize. Here are a few things to think about when making that decision.
Consider How Long You’ve Been in Your Home
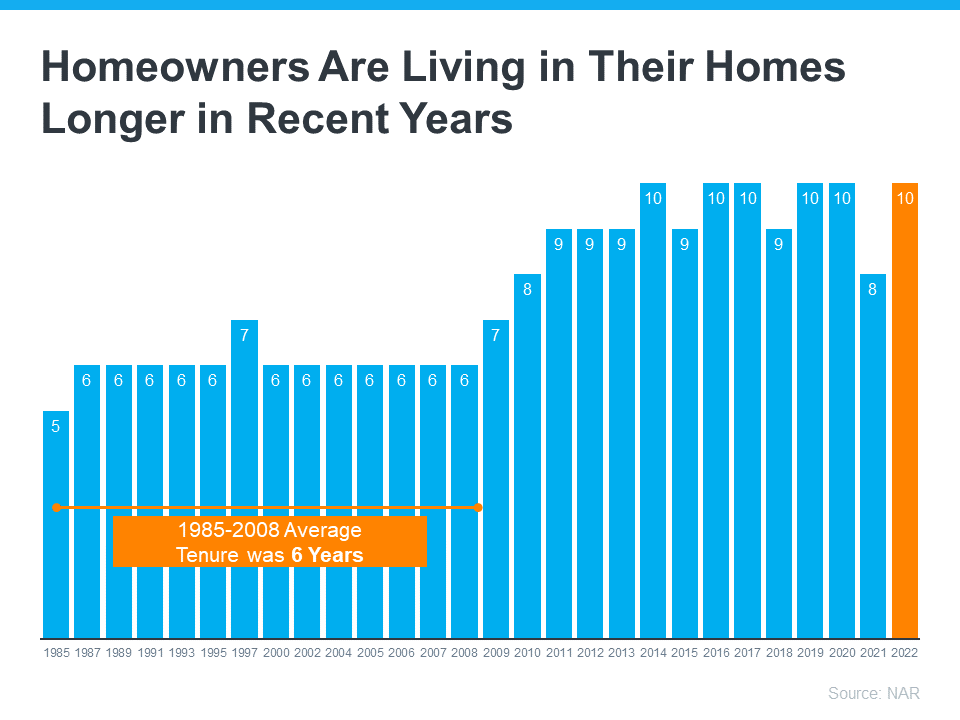
From 1985 to 2008, the average length of time homeowners typically stayed in their homes was only six years. But according to the National Association of Realtors (NAR), that number is rising today, meaning many homeowners are living in their houses even longer (see graph below):
When you live in a home for a significant period of time, it’s natural for you to experience a number of changes in your life while you’re in that house. As those life changes and milestones happen, your needs may change. And if your current home no longer meets them, you may have better options waiting for you.
Consider the Equity You’ve Gained
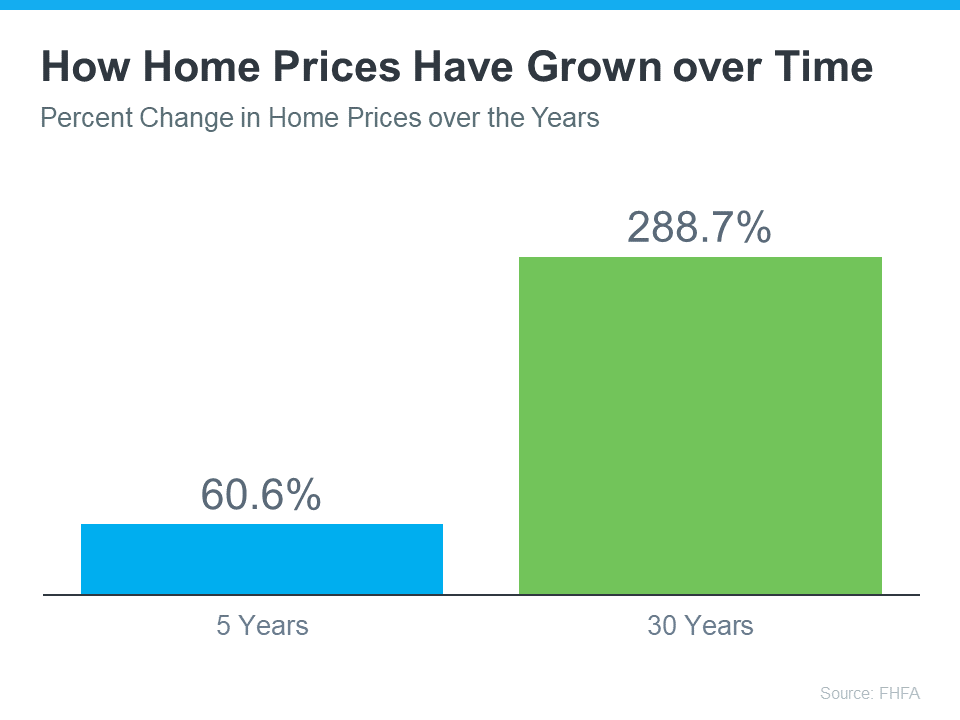
Additionally, if you’ve been in your home for more than a few years, you’ve likely built up significant equity that can fuel your next move. That’s because the longer you’ve been in your home, the more likely it’s grown in value due to home price appreciation. Data from the Federal Housing Finance Agency (FHFA) illustrates that point (see graph below):
While home price growth varies by state and local area, the national average shows the typical homeowner who’s been in their house for five years saw it increase in value by over 50%. And the average homeowner who’s owned their home for 30 years saw it almost triple in value over that time.
Consider Your Retirement Goals
Whether you’re looking to downsize, relocate to a dream destination, or move so you live closer to loved ones, that equity can help you achieve your homeownership goals. NAR shares that for recent home sellers, the primary reason to move was to be closer to loved ones. Plus, retirement played a large role for those moving greater distances.
Whatever your home goals are, a trusted real estate advisor can work with you to find the best option. They’ll help you sell your current house and guide you as you buy the home that’s right for you and your lifestyle today.
Bottom Line
Retirement can bring about major changes in your life, including what you need from your home. Let’s connect to explore your opportunities in our local market.
Why There Won’t Be a Flood of Foreclosures Coming to the Housing Market

With the rapid shift that’s happened in the housing market this year, some people are raising concerns that we’re destined for a repeat of the crash we saw in 2008. But in truth, there are many key differences between what’s happening today and the bubble in the early 2000s.
One of the reasons this isn’t like the last time is the number of foreclosures in the market is much lower now. Here’s a look at why there won’t be a wave of foreclosures flooding the market.
Not as Many Homeowners Are in Trouble This Time
After the last housing crash, over nine million households lost their homes due to a foreclosure, short sale, or because they gave it back to the bank. This was, in large part, because of more relaxed lending standards where people could take out mortgages they ultimately couldn’t afford. Those lending practices led to a wave of distressed properties which made their way into the market and caused home values to plummet.
But today, revised lending standards have led to more qualified buyers. As a result, there are fewer homeowners who are behind on their mortgages. As Marina Walsh, Vice President of Industry Analysis at the Mortgage Bankers Association (MBA), says:
“For the second quarter in a row, the mortgage delinquency rate fell to its lowest level since MBA’s survey began in 1979 – declining to 3.45%. Foreclosure starts and loans in the process of foreclosure also dropped in the third quarter to levels further below their historical averages.”
There Have Been Fewer Foreclosures over the Last Two Years
While you may have seen recent stories about the number of foreclosures rising today, context is important. During the pandemic, many homeowners were able to pause their mortgage payments using the forbearance program. The program gave homeowners facing difficulties extra time to get their finances in order and, in many cases, work out a plan with their lender.
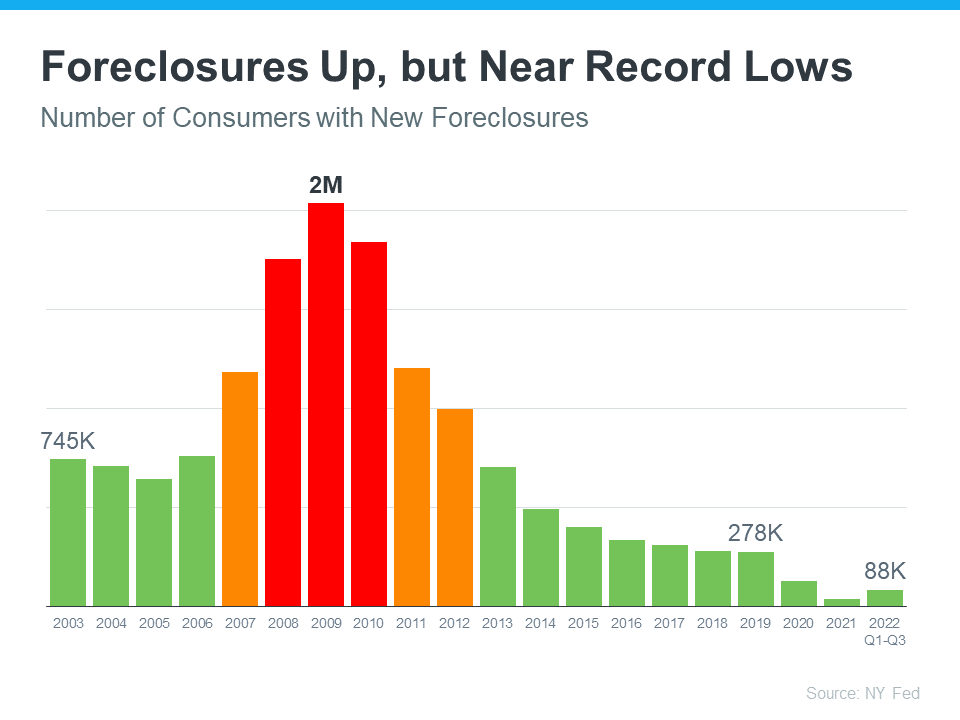
With that program, many were concerned it would result in a wave of foreclosures coming to the market. That fear didn’t materialize. Data from the New York Fed shows there are still fewer foreclosures happening today than before the pandemic (see graph below):
That means, while there are more foreclosures now compared to last year (when foreclosures were paused), the number is still well below what the housing market has seen in a more typical year, like 2017-2019.
And most importantly, the number we’re seeing now is still far below the number we saw during the market crash (shown in the red bars in the graph). The big takeaway? Don’t let a headline in the news mislead you. While foreclosures are up year-over-year, historical context is essential to understanding the full picture.
Most Homeowners Have More Than Enough Equity To Sell Their Homes
Many homeowners today have enough equity to sell their homes instead of facing foreclosure. Due to rapidly rising home prices over the last two years, the average homeowner has gained record amounts of equity in their home. And if they’ve stayed in their homes even longer, they may have even more equity than they realize. As Ksenia Potapov, Economist at First American, says:
“Homeowners have very high levels of tappable home equity today, providing a cushion to withstand potential price declines, but also preventing housing distress from turning into a foreclosure. . . the result will likely be more of a foreclosure ‘trickle’ than a ‘tsunami.’”
A recent report from ATTOM Data explains it by going even deeper into the numbers:
“Only about 214,800 homeowners were facing possible foreclosure in the second quarter of 2022, or just four-tenths of one percent of the 58.2 million outstanding mortgages in the U.S. Of those facing foreclosure, about 195,400, or 91 percent, had at least some equity built up in their homes.”
Bottom Line
If you see headlines about the increasing number of foreclosures today, remember context is important. While it’s true the number of foreclosures is higher now than it was last year, foreclosures are still well below pre-pandemic years. If you have questions, let’s connect.

 Facebook
 X
X
 Pinterest
 Copy Link

